How do you brew the perfect cup of filter coffee? Some steps might seem obvious, like starting with high-quality, freshly ground coffee and clean, filtered water. But what about the brewing process itself?
For decades, coffee professionals and home brewers have turned to the Coffee Brewing Control Chart (BCC) for a defined standard of coffee brewing.
Created in 1957 by Ernest E. Lockhart of the Coffee Brewing Institute, the BCC has achieved legendary status within the coffee industry. Split into a nine-part grid that’s reminiscent of Tic-tac-toe, the chart allows users to judge whether the coffee they’ve brewed is too weak or strong, or, in the center square, ideal and optimally balanced. The Specialty Coffee Association (SCA) has used it as a teaching tool since the 1980s, and bases much of its foundational coffee knowledge on the chart.
Coffee science has come a long way since the ’50s, however, and so a team of researchers at the new UC Davis Coffee Center, supported by the SCA and with funding from Breville, sought to update Lockhart’s work for the 21st century. The result is the Sensory and Consumer Brewing Control Chart, which combines new coffee science with consumer research and a more user-friendly approach.
The update has been a welcome one among many in the coffee industry. But what did updating Lockhart’s classic chart for a new generation entail?
A Look Back
Lockhart was a biochemist and the first director of the Coffee Brewing Institute (CBI). The CBI was an early-1950s initiative by the National Coffee Association and the Pan American Coffee Bureau, and had the goal of grounding the nascent coffee industry in hard science.
According to an article by Emma Bladyka in The Specialty Coffee Chronicle, “much of the work conducted by the CBI was towards determining the optimal methodology to brew good coffee … This focus on the consumer led the Institute to realize that the majority of complaints around coffee were the direct result of improper brewing methods.”
Lockhart published his findings in 1957 in a paper called “The Soluble Solids in Beverage Coffee as an Index to Cup Quality.” The paper introduced the BCC, which used total dissolved solids (TDS) and extraction yield to help users determine the quality of their brew. TDS is the amount of soluble material that has been extracted from the coffee and ends up in your cup, whereas the extraction yield is the percentage of the coffee grounds that dissolve during brewing.
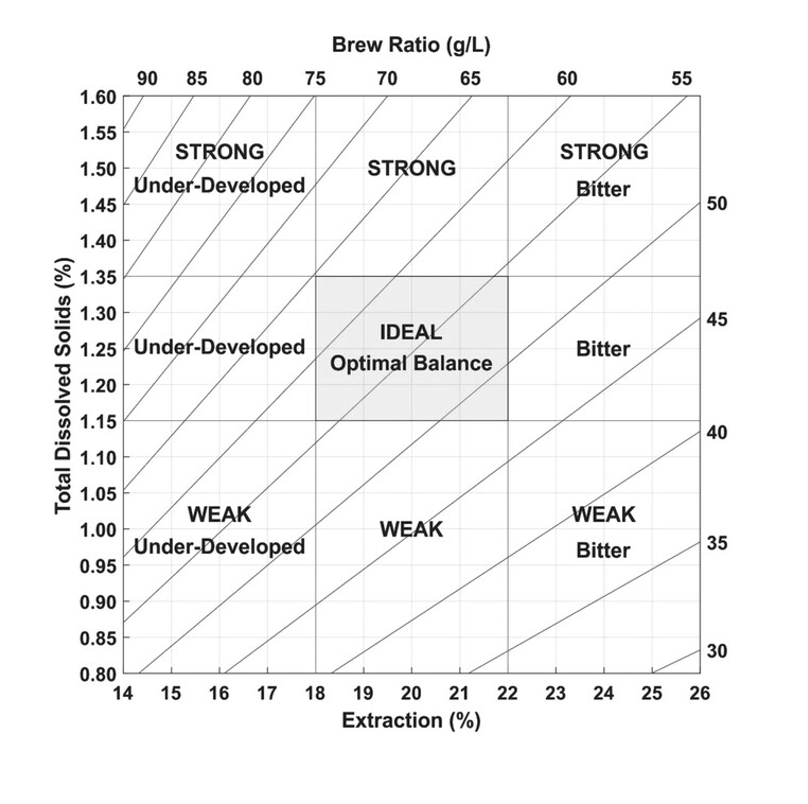
Essentially, Lockhart distilled coffee brewing into a simple idea: that the quality of a cup of coffee could be quantified by measuring how much of the ground coffee had dissolved into the liquid. His findings became a crucial reference for the coffee industry.
“This chart, and the paper that explained it, is really the foundation of all of our modern thinking of how coffee extraction works,” says Peter Giuliano, executive director of the Coffee Science Foundation and chief research officer of the SCA.
Lockhart’s research was a huge step forward in coffee science, Giuliano says, and his work influenced the entire industry. “Lockhart’s genius was to realize that measuring dissolved solids in coffee could serve as an indicator—or ‘index’—to coffee quality,” Giuliano says. “That insight became a tool that could use physical measurement of total dissolved solids to help coffee professionals recognize well-brewed coffee.” For Lockhart, the ideal range for filter coffee was between 18–22% extraction and between 1.15–1.35% TDS. Anything outside of these measurements would result in under- or over-extracted (and therefore unpleasant) coffee.
This chart has been the backbone for everything we know about coffee brewing, but after 60-plus years, it became clear that it was in need of an update. For one thing, coffee science has come a long way in the decades since the original chart was published. Lockhart used 1950s-era tools like hydrometers (instruments that measure the density of liquids) and mercury thermometers in his research, while today there are a number of gadgets that can do the same job faster and more accurately.
Combined with advances in chemical analysis and sensory science, this meant that it was possible to retest Lockhart’s conclusions and gauge their accuracy. “To our delight, we discovered that not only was Lockhart’s theory of TDS being a good indicator of coffee’s flavor correct, it was even more interesting than we anticipated,” Giuliano says.
The Coffee Science Foundation teamed up with the UC Davis Coffee Center to update the BCC, a project that produced three peer-reviewed papers over seven years. It all culminated in a study published in the Journal of Food Science and an all-new Sensory and Consumer Brewing Control Chart, which the authors hope “can be used by brewers of drip coffee to design coffees with specific sensory profiles and match the preferences of different consumer types.”
Updating a Classic
Researchers from UC Davis began working on the new chart in 2017. Although the process was relatively straightforward, it was also labor-intensive, says Dr. William Ristenpart, the founding director of the UC Davis Coffee Center and one of the authors of the latest study.
Lockhart’s original chart utilized a few simple tasting notes, Ristenpart says, whereas contemporary resources like the World Coffee Research’s tasting lexicon and the Coffee Taster’s Flavor Wheel list more than 100 possible flavor attributes in black coffee. In order to make the new chart as robust and useful as possible, Ristenpart and his fellow researchers set out to gain as much sensory data as they could to inform the new chart. “The experimental design was, in one sense, simple: Let’s take the same coffee and brew it to different extraction yields and different TDS’s, and then taste the heck out of it,” Ristenpart says. “It’s easy to say, [but it was also] very laborious.”
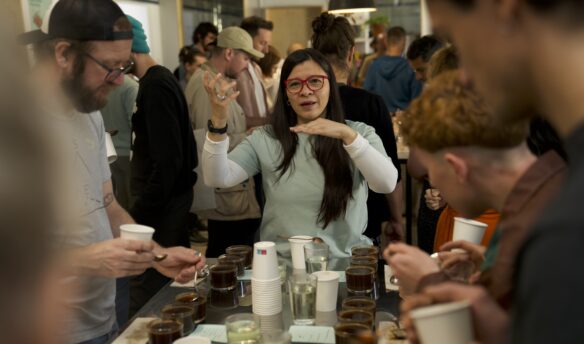
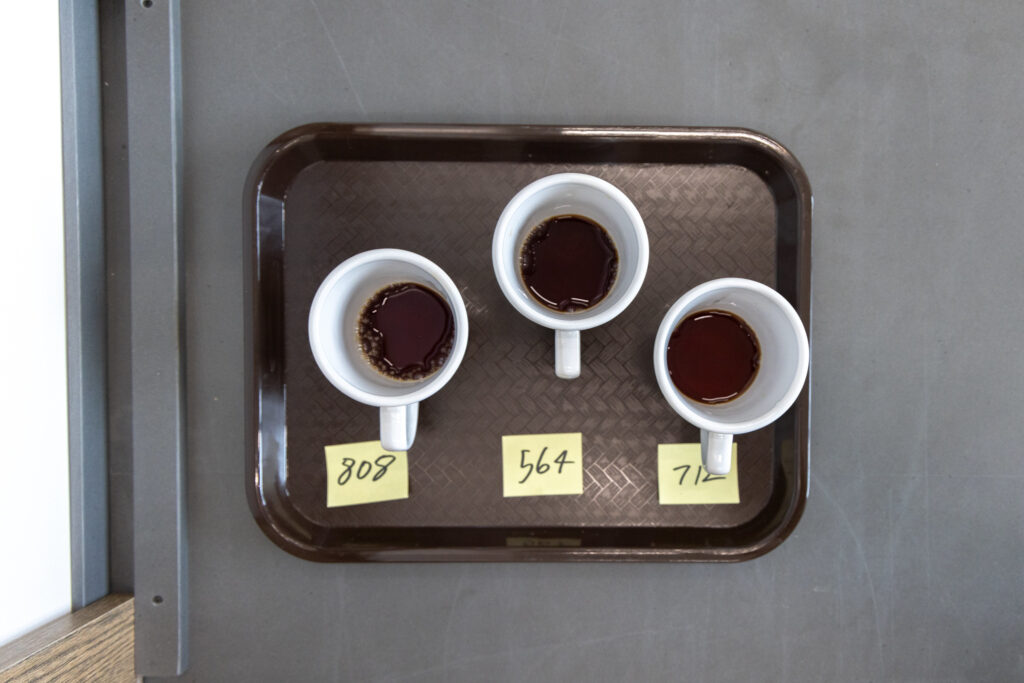
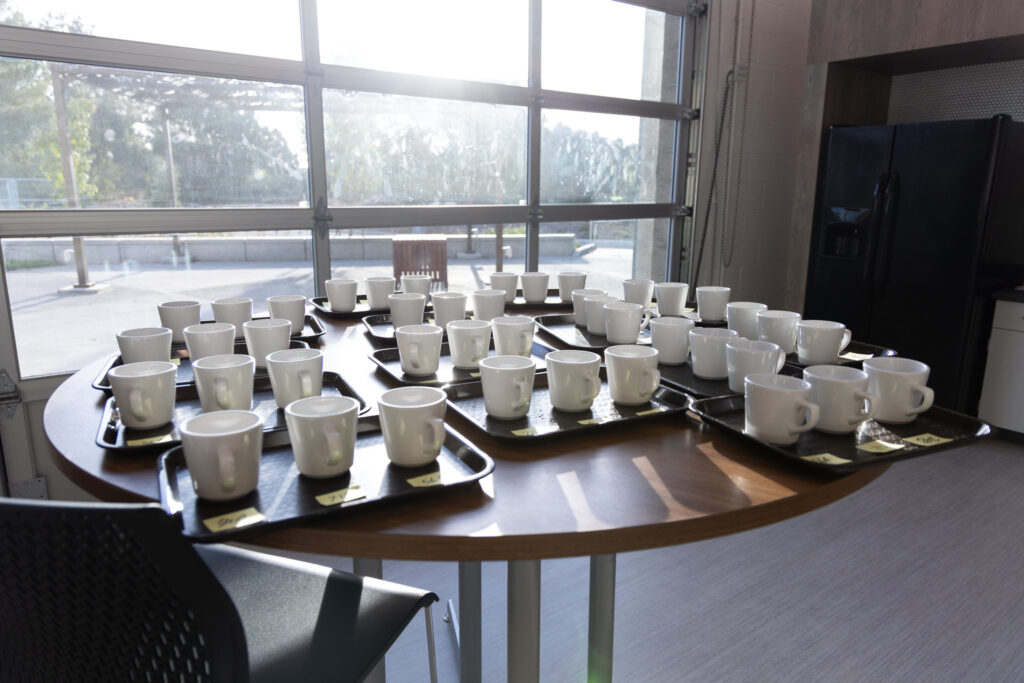
In order to gather that data, the researchers recruited small teams of coffee tasters—each panel consisted of 12 volunteers—who then had to be calibrated, a process which took several weeks. If you’ve ever tried to agree with a group of coffee people what, exactly, “acidic” or “bitter” means, you’ll know how tricky the calibration process can be. (Ristenpart describes having the panel all agree on what exactly “rubber” smells like by smelling a rubber band.)
The researchers also carried out consumer preference testing, brewing coffee in different styles for a group of mostly college students from UC Davis to figure out which ones they liked the best. The outcome was quite similar to Lockhart’s findings all those years ago, with the average person’s preferences ending up right in the middle of the chart. However, Ristenpart notes that this is slightly misleading: “It’s more accurate to say that it was the coffee that displeased the least people.”
This consumer preference data—which Ristenpart acknowledges is biased towards a younger, North American demographic—was combined with the researchers’ technical and sensory data, and condensed to create the new charts.
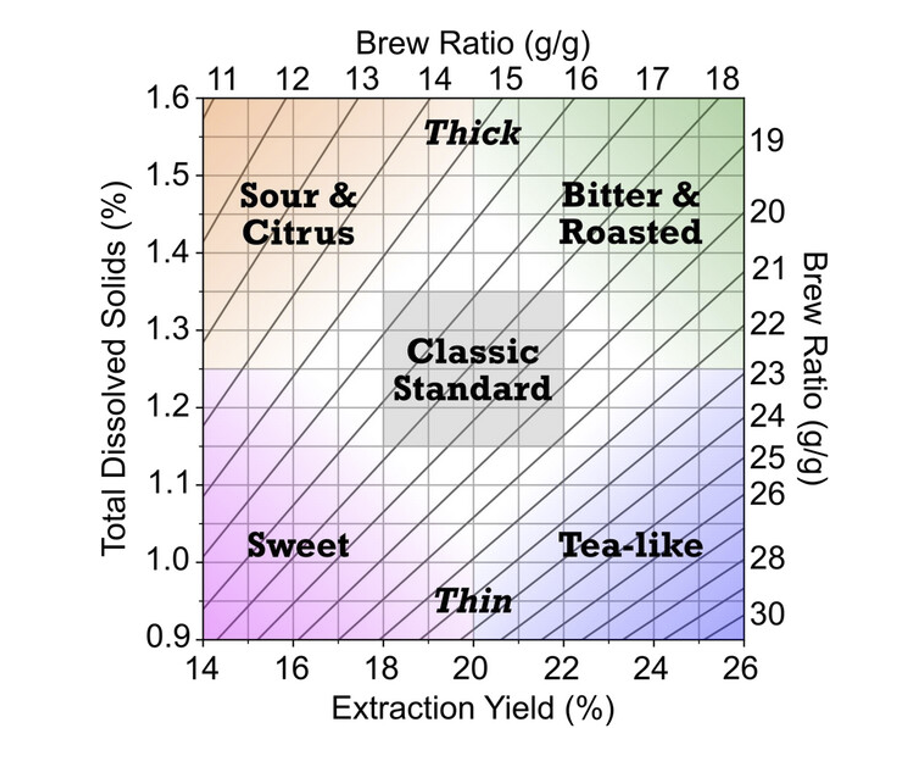
Unlike Lockhart, the researchers produced four versions of the brewing chart: the first showing the main sensory attributes in black drip coffee; the second a visual depiction of the consumer preference research; these were then combined into a third chart which overlays the consumer data on top of the sensory attributes. The final chart is a streamlined version of the third, the layout of which in many ways echoes Lockhart’s original.
In the study, the authors summarize the combined Sensory and Consumer Brewing Control Chart as “reflect[ing] the integration and culmination of our comprehensive sensory and consumer research on the effects of brewing variables on the sensory quality and consumer acceptance of drip brew coffee.”
In the streamlined chart, the left vertical axis shows TDS, the bottom horizontal axis shows extraction yield, and the right vertical and top horizontal axes show the brew ratio with diagonal lines running from each number. It has fewer sensory descriptors than the combined chart but still includes the “ideal” zone in reference to Lockhart’s original chart.
How To Brew Coffee in 2024
Most hobbyists—and even many coffee professionals—won’t have a TDS meter or refractometer at home to test their morning coffee against the chart. However, Ristenpart says that using a scale and comparing your coffee-to-water ratio to the graph, while adjusting grind size and brew time, will give you a good idea of what sort of flavors you can expect.
As an example: Two brews, one with fine-ground coffee and one with coarse-ground coffee, will brew at different speeds and have a higher and lower TDS. Users can then reference the chart and, hopefully, match the sensory descriptors to what they have brewed—sweet in the bottom left, bitter in the top right. “You won’t know exactly where [on the chart] because you don’t have a way of measuring TDS, but one’s going to be down to the lower left and one’s going to be upper right,” Ristenpart says.
For Giuliano, the updated chart reflects what Lockhart knew all along: that one can use TDS and extraction percentages to accurately predict specific qualities—like acidity, sweetness, and bitterness—when brewing a coffee. This is, he says, “a powerful tool for professional and amateur coffee brewers alike.”
Ristenpart notes that, using the chart, it is even possible to accentuate certain flavors and make a single coffee taste markedly different, depending on how it is brewed. “You could take the same pile of coffee beans and then, depending on how you grind them and how you extract them, get them to different corners of the Coffee Brewing Control Chart, which will make those same coffee beans taste differently.”
Even though the research affirms many of Lockhart’s original findings, Giuliano notes one big difference. Despite Lockhart’s original assertion that there was one ideal brewing zone, coffee consumers have a wide and diverse set of preferences. “‘Good coffee’ is not a singular thing,” he says, “but can mean different things to different consumer groups.”
Photos courtesy of Mario Rodriguez for UC Davis


